
“But how much is that in today’s money?”
Anyone who’s taught the US survey has heard this question dozens of times. It a completely understandable one, and often impels students to seek out online calculators that claim they can “convert” old timey money into today’s currency.
I usually try to answer this question by talking about why these conversions can’t account for the significant differences in global economic systems and daily life between the past and present. Instead, I urge students to think about the amounts of money they see in relation to each other and in relation to what we know about property ownership at the time.
For instance, when reading late 17th century Virginian interracial sex laws, students see that there was a £15 fine leveled on a white woman who had a mixed-race child out of wedlock; if she could not pay the fine, she was forced to work it off in service to someone else. It’s helpful to give students a sense of how much passage to Virginia cost by way of comparison, but even without that information, students can figure a lot out just by thinking about what they know about coverture and indentured servitude.
But it can also be cool to have students build a snapshot of the economy as a group, and I often have them do that as part of a newspaper project in my US I survey. The assignment asks students to pick one issue of a newspaper from 1848 and examine it in a variety of ways over the course of the semester. I generally provide students with a list of newspapers to pick from, based on the database access at the institution, to ensure we get geographical coverage, and have them pick the issue closest to their birthday, which usually gets us a good mix of dates.
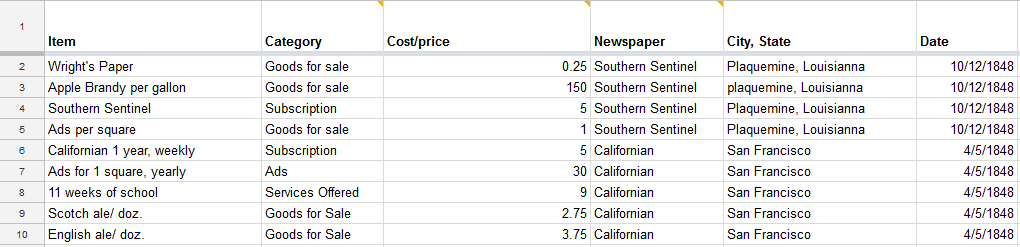
For one part of the assignment, students are asked to find every amount of money listed in their newspaper – prices in ads, costs mentioned in articles, even subscription costs – and add them to a big class spreadsheet. It ends up looking something like this, with columns for the item, the cost, the newspaper, the location, and the date, with an additional column categorizing the entry as goods, services, the cost of a subscription, or the cost of placing an ad in the newspaper.
This assignment is challenging and instructive not only in what it produces but also in the process of constructing it. For many students, it is the first time they have navigated Google Sheets or Excel, at least for the purpose of something in the humanities, and while I have to do a bit of coaching there, it’s well worth it for them to learn that skill. But the bigger gains come from having to consider how to make their information “fit,” what that does to the data they’ve collected, and what to do when they just can’t make it fit.
One of the first challenges students face is how to read the ads they come across, and I ask students to share confusing ads with the class as they work through their newspapers. What do all of these quotation marks mean? What does “bbl” mean? What do I do with half cents? What do I do with prices that are listed in British money? Many of these issues can be resolved in the spreadsheet itself, but the ones that can’t be resolved as easily – especially the persistent use of foreign currency – make students aware of economic dynamics of the past and the ways that manipulating data for the purpose of analysis isn’t simple or neutral.
When complete, the spreadsheet allows students to see how their newspaper’s economic information compares to that of their peers’ newspapers, and to begin to draw some conclusions about domestic, international, and regional economies.
Of course students are stunned by the variety of medicines on offer, and we get to snicker at the list of ailments that Dr. So-and-so’s pills claim to cure. But they are also stunned to see ads for upcoming auctions of enslaved people, and in particular, to see how those ads are mixed in with all of the ads for land and purgatives and 5 volume sets of European writers. They know, intellectually, about the trade in enslaved people, but as with Every Three Minutes, they are affected here by the mundanity of it.
They’re also usually quite surprised at the amount of imported foreign goods, but for different reasons than they’re surprised at the amount of foreign news. Any inflated ideas about America’s manufacturing and cultural output are dealt a blow by seeing just how many items, particularly luxury items, are being imported. When put into conversation with the amount of foreign news they find in their newspapers, though, this economic data also unsettles their assumptions that 19th century Americans were wholly provincial and disconnected from global issues.
The spreadsheet also allows them to see variation between regional economies, both in the cost of goods and services and the specific goods and services offered. A student working on a Connecticut newspaper might notice ads from insurance companies they recognize, but only with the help of their classmate doing a newspaper from South Carolina do they see that insurance company advertising policies that cover enslaved people.
The spreadsheet doesn’t provide perfect or complete context, and it is different every time we build it, based on the newspapers and dates chosen, but it always produces interesting comparisons and provocative questions. And sometimes it produces results I couldn’t have dreamed of, results that show the realities of 19th century life so vividly.
One semester, two students found ads for whiskey in their newspapers. The student working on a Virginia newspaper found whiskey advertised for 24¢ a gallon. The student working on a California newspaper, in the middle of the gold rush, found whiskey advertised for 25¢ a glass. They raised this comparison in class when we got to our discussion of California, and it tempered the romantic notions some of them had about going west and getting rich. Later that week, when the class read a primary source that criticized Chinese immigrants for bringing rice with them instead of buying it in California, almost every student used the discussion about whiskey prices to help them understand why immigrants would do this.
While I pick 1848 for lots of reasons (it’s just the best year for so many things), I have also done the assignment with 18th century newspapers and Civil War newspapers with great success. I created it while teaching at a university with access to Early American Newspapers, but have easily adapted it to use Chronicling America and other open access digital newspapers databases now that I teach students with no Readex access.
This kind of assignment helps students learn practical and abstract ideas about data collection and organization while giving them the kind of relational economic context that they need to understand the specific financial realities faced by real people living in the past. Moreover, for students who are young and often inexperienced with some parts of the economy and the financial decisions made by people around them every day, the assignment gets them thinking about the economic world they live in.
Just as learning a foreign language forces you to become conscious of the grammar of your native language, exploring the economic lives of people in the past can make you think about the economic realities of the present that you might take for granted. The process of making the spreadsheet prompts students to ask questions about how the economy worked in 1848, and in turn, how it works in their lives. If it just did the former, it would still be a useful assignment. That it does the latter makes it, to my mind, a productive and provocative assignment.
