
So you want to integrate the uses of GIS into your research and teaching? Great! Let’s look at the ways a GIS works.
Exploring the potential of GIS technologies is a first step in approaching how spatiality can intervene and create new knowledge in our work. Many scholars (and students) are often tied to interpreting history within a temporal lense in an effort to recognize causality and outcome. Spatiality itself can help interpret history by showing how space and place dictate movement, settlement, and access to resources. The objective of this post is to highlight for scholars, students, and instructors what a GIS can do. To that end we must acquaint ourselves with the five main groups of GIS tasks and their accompanying performance range:[1]
| Database Acquisition
*Primary Data Collection *Digital Maps *Remote Sensing *Data Entry |
Spatial Data Management
*Coordinate transformation *Georectification *Metadata construction *Building topologies *Spatial Data Cleaning |
Database Management
*Data Modeling *Database construction *metadata construction *data updates
|
Spatial Data Visualization
*Digital Cartography *Thematic mapping *3D Visualization *Data pattern exploration |
Spatial Data Analysis
*queries -location, attribute, *locational analysis *spatial analysis *Movement modelling *visibility modelling *Surface modeling
|
We will begin with spatial data acquisition– In a GIS software platform data collected may include, topographic maps, site locations and morphology, archaeological plans, artefact distributions, air photography, satellite imagery and more.
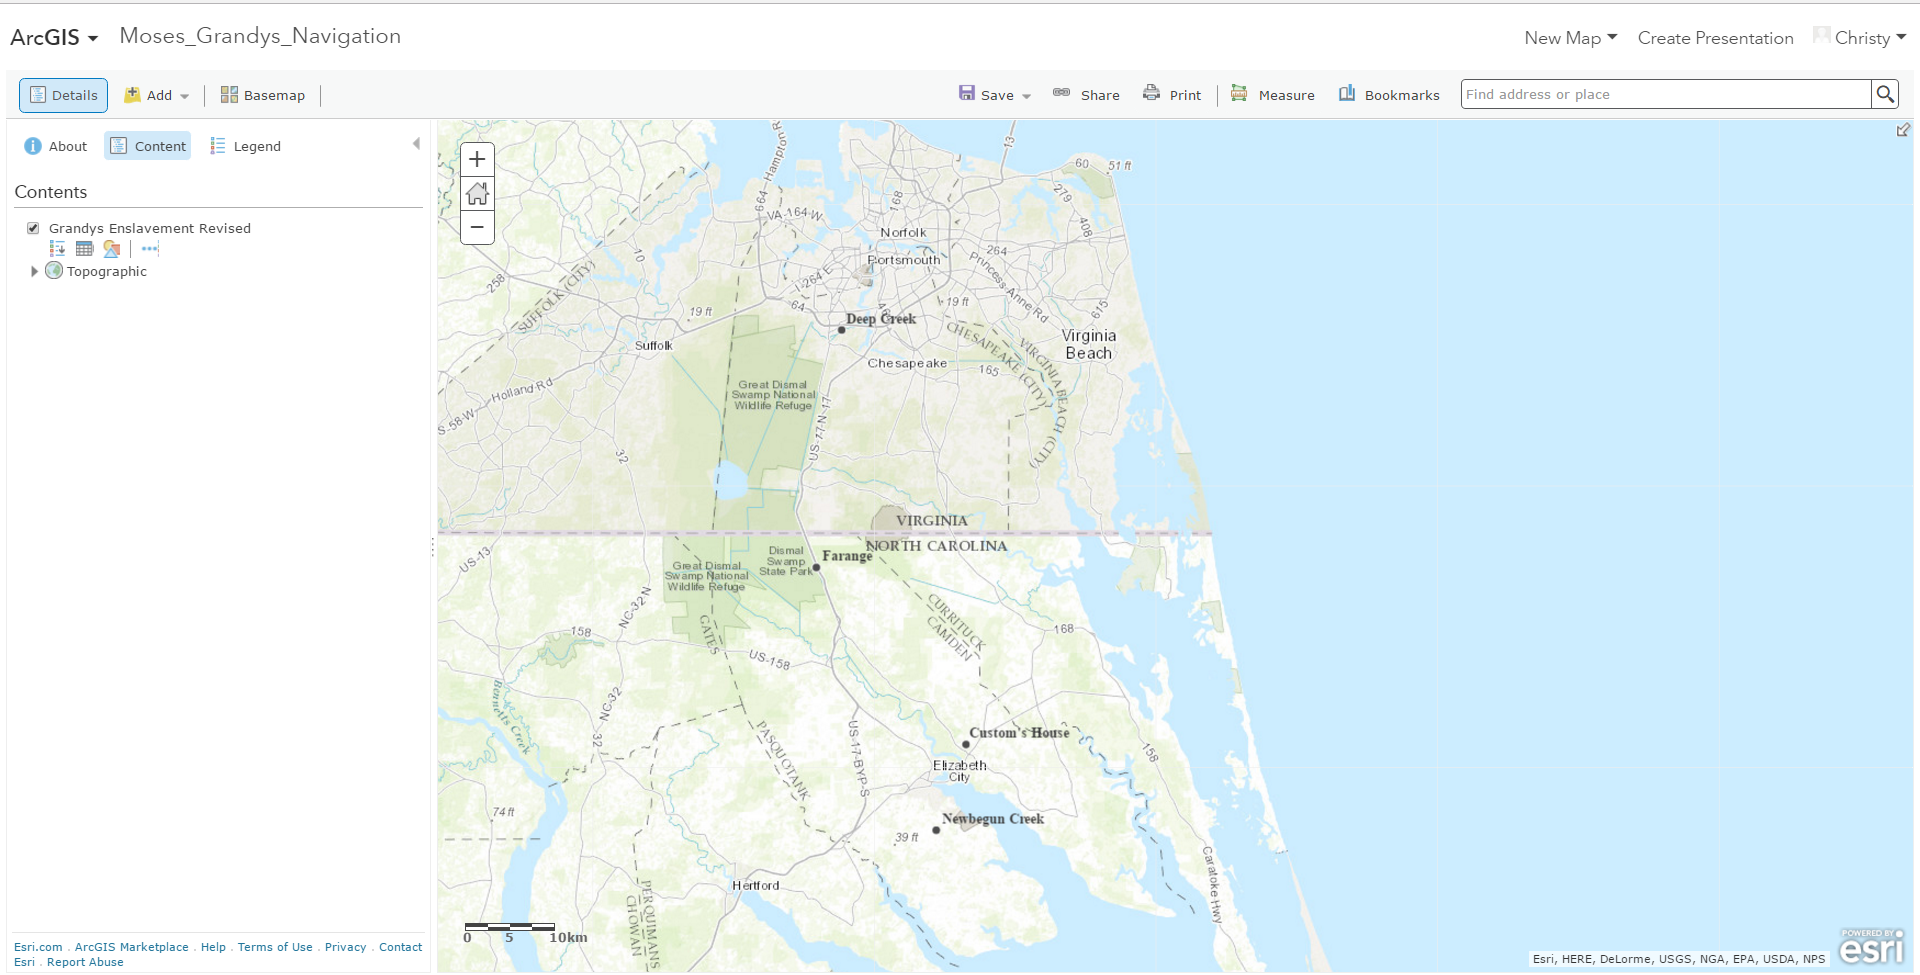
Of course location data can be qualitative or quantitative. In my own research of trying to locate the sites included in enslaved people’s navigational literacy I often have to derive location data from textual description. For instance, when enslaved waterman Moses Grandy indicates in his narrative that his owner Enoch Sawyer was at Major Farange’s hotel when he and ally Captain Minner went there to confront the slaver to purchase Grandy’s freedom I had to investigate where Major Farange’s hotel was located. This structure no longer stands, thus it required a bit of digging to find- but I persevered, thankfully. From there I identified the coordinates and added the location to my data collection.
Spatial data management within a GIS stores and retrieves spatial data and its attributes. These functions include the transformation of coordinate systems to enable data collected to be integrated as well as the “cleaning” of datasets and the creation of geospatial metadata. Because this is getting into some very “techy” sounding territory I will provide a resource link that unpacks this pretty well:
http://tdan.com/introduction-to-geospatial-data-management/4944
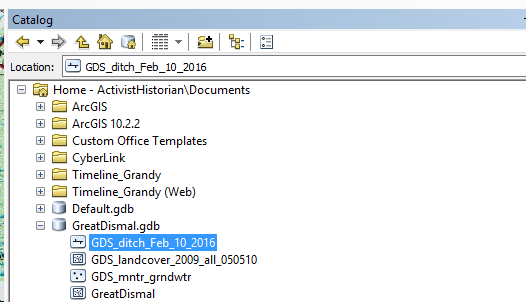
With database management a great utility emerges within a GIS because it provides an environment for linking and exploring relationships between spatial and non-spatial data(usually within a specific location focus area). From the creation of geodatabases the data contained is merged and becomes an environment where spatial analyses may occur. For example, when I created a geodatabase containing a variety of data from the Great Dismal Swamp I was able to look for patterns within the geodatabase to discover morphological variability-which helps me get closer to understanding the terrain that is at the center of my research on enslaved people escaping into and out of the Great Dismal Swamp during the antebellum era.
Spatial data analysis is another winner of the great things GIS can do which includes exploring visibility, movement, distance across landscapes and more involved processes such as geostatistical modelling. This is another territory of techy-laden description. The following link parses spatial data analysis out fairly well:
http://dusk.geo.orst.edu/gis/Chapter14_notes.pdf
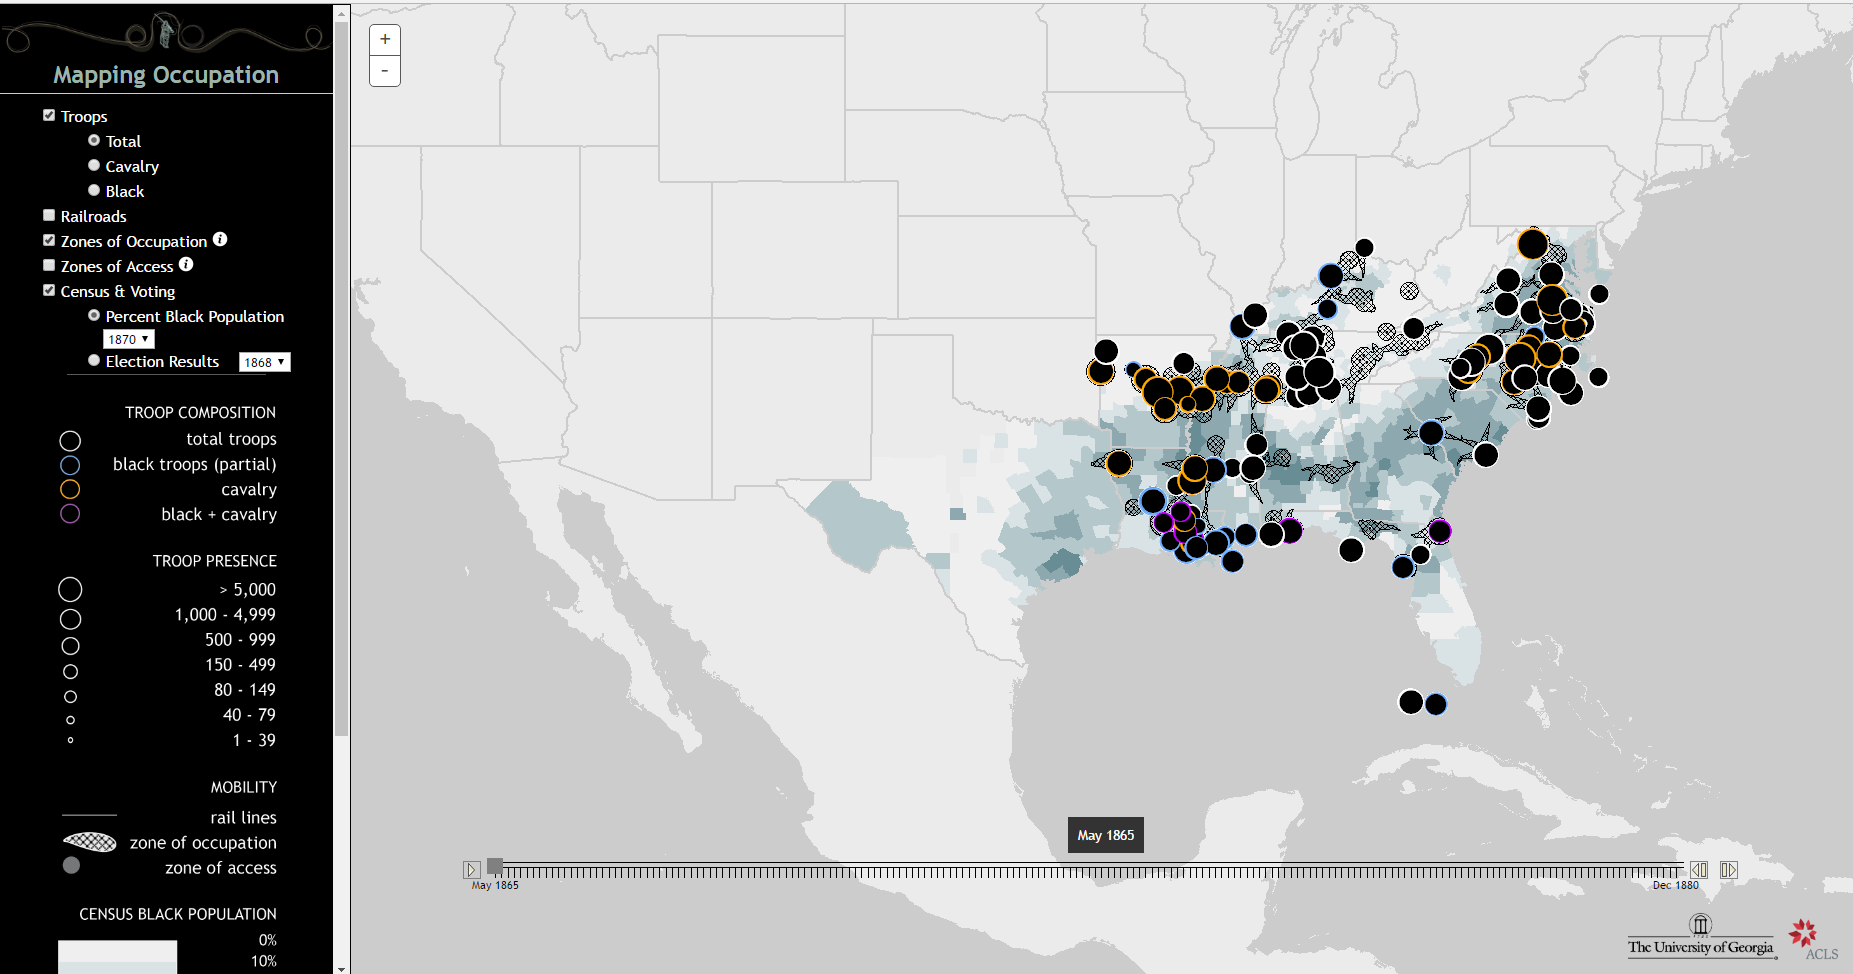
Finally spatial data visualization has the capability to view spatial data in very interesting ways. Spatial visualization is the representation of data in a viewable medium or format. In a GIS, visualization is used to organize spatial data and related information into layers that can be analyzed or displayed as maps, three-dimensional scenes, summary charts, tables, time-based views, and schematics. Gregory P. Downs and Scott Nesbit created Mapping Occupation to capture the regions where the United States Army acted as an occupying force in the Reconstruction South. It serves as an excellent example of visualization.
You can read more about Mapping Occupation here:
http://mappingoccupation.org/index.html
With the GIS tasks highlighted here these capabilities can help guide humanistic approaches to spatial inquiry and help instructors see what GIS tasks may work best for exploration within the classroom. The foremost guiding force in spatial inquiry, however, is the question. Good luck everyone!
[1] James Conolly and Mark Lake. GIS in Archaeology. Cambridge, UK: Cambridge University Press, 2006.13
