
Instructors who are interested in applying Geographical Information Systems (GIS) to history teaching in the classroom can do so through integrating web based activities. Classes designed in this way would consist of two components – a lecture and computer lab time.
In providing students with an introduction to GIS and geospatial data, learning concepts involving GIS helps them acquire skills for spatial analysis while they explore human uses of and impacts on landscapes using geospatial technologies With these methods, students have the opportunity to analyze how spatial and temporal patterns shape history and cultural practices. In this post I will highlight some possibilities for lab activities and considerations for designing classes which integrate GIS.
There are several GIS applications available for instructors to explore as they develop a GIS component to teaching. Some examples are Carto and Google Maps.
CARTO Engine
An Open Source tool that enables users to build dynamic geospatial datasets and scalable maps. CARTO is a cloud computing platform that provides GIS and web mapping tools for display in a web browser.
*CARTO is offered as “freemium” service, where accounts are free up to a certain size.
What you can do: Visualisation, Data Management, Spatial Analysis
What I did:
Working with data displaying Great Dismal Swamp drainage ditches (initially hand dug by enslaved people) I created a map. The application allows you to upload data for visualization.
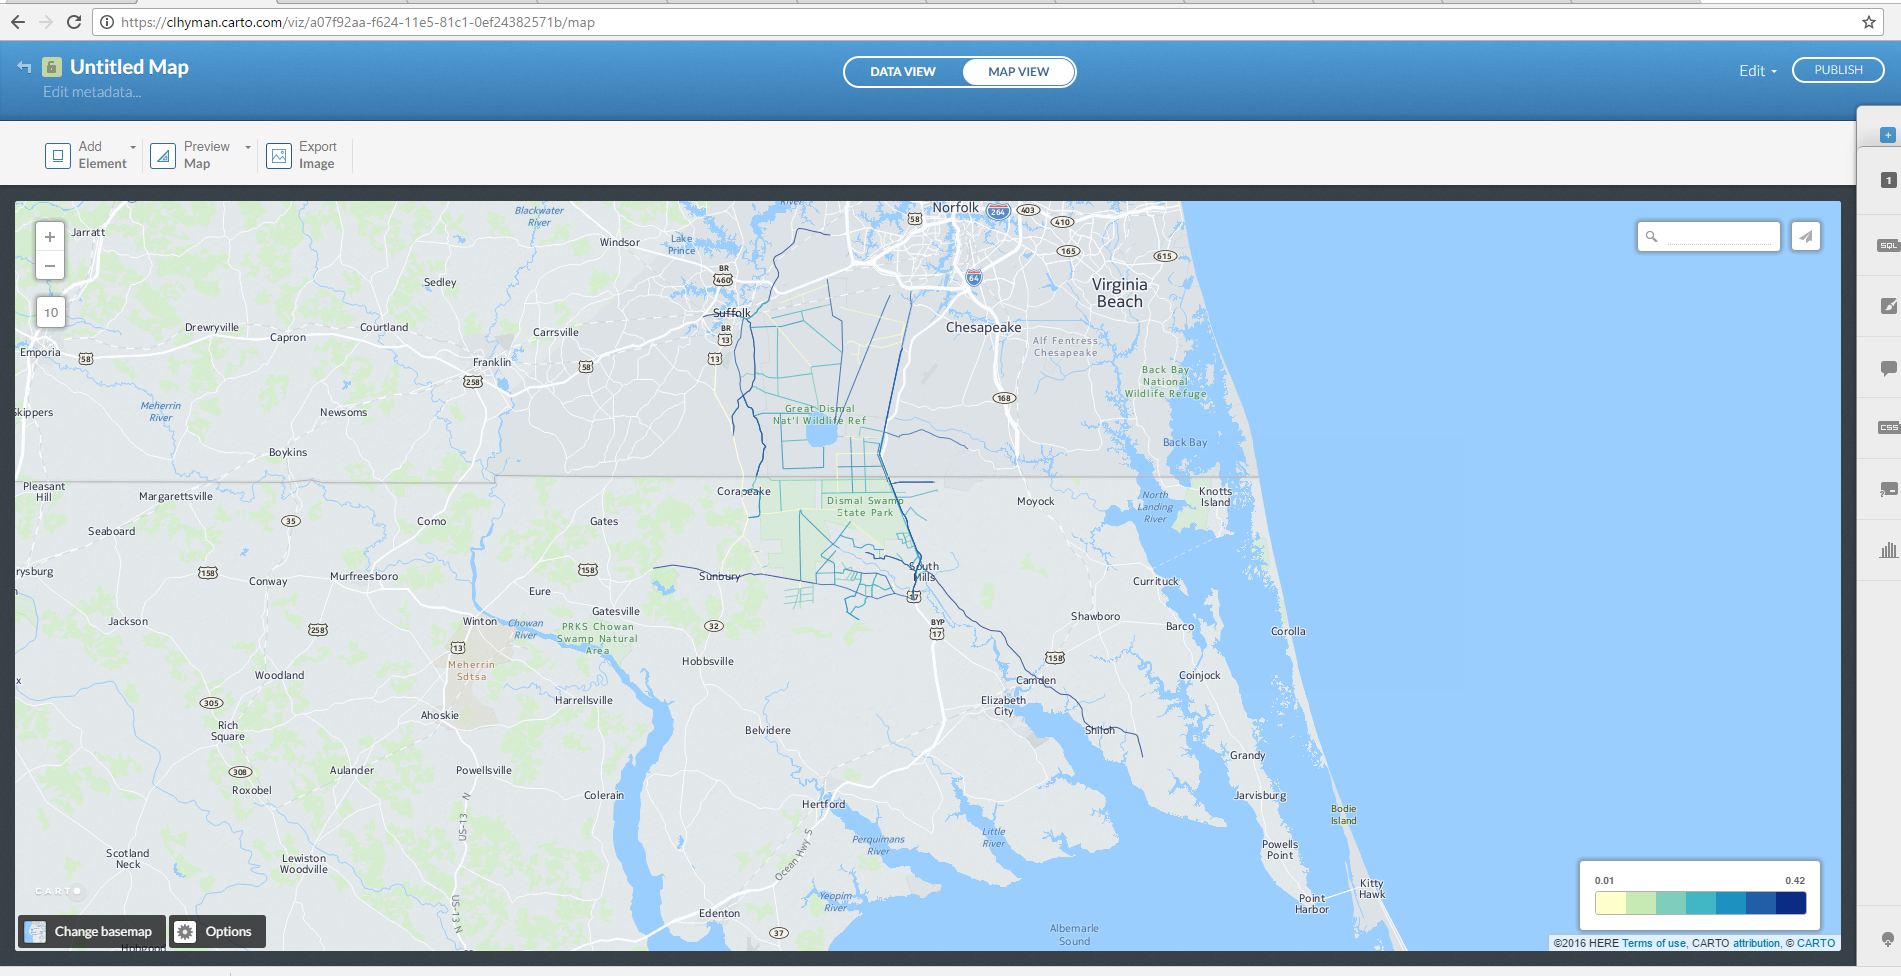
CARTO provides many useful guides for mapmaking and spatial analysis that can be found here: https://carto.com/learn/guides.
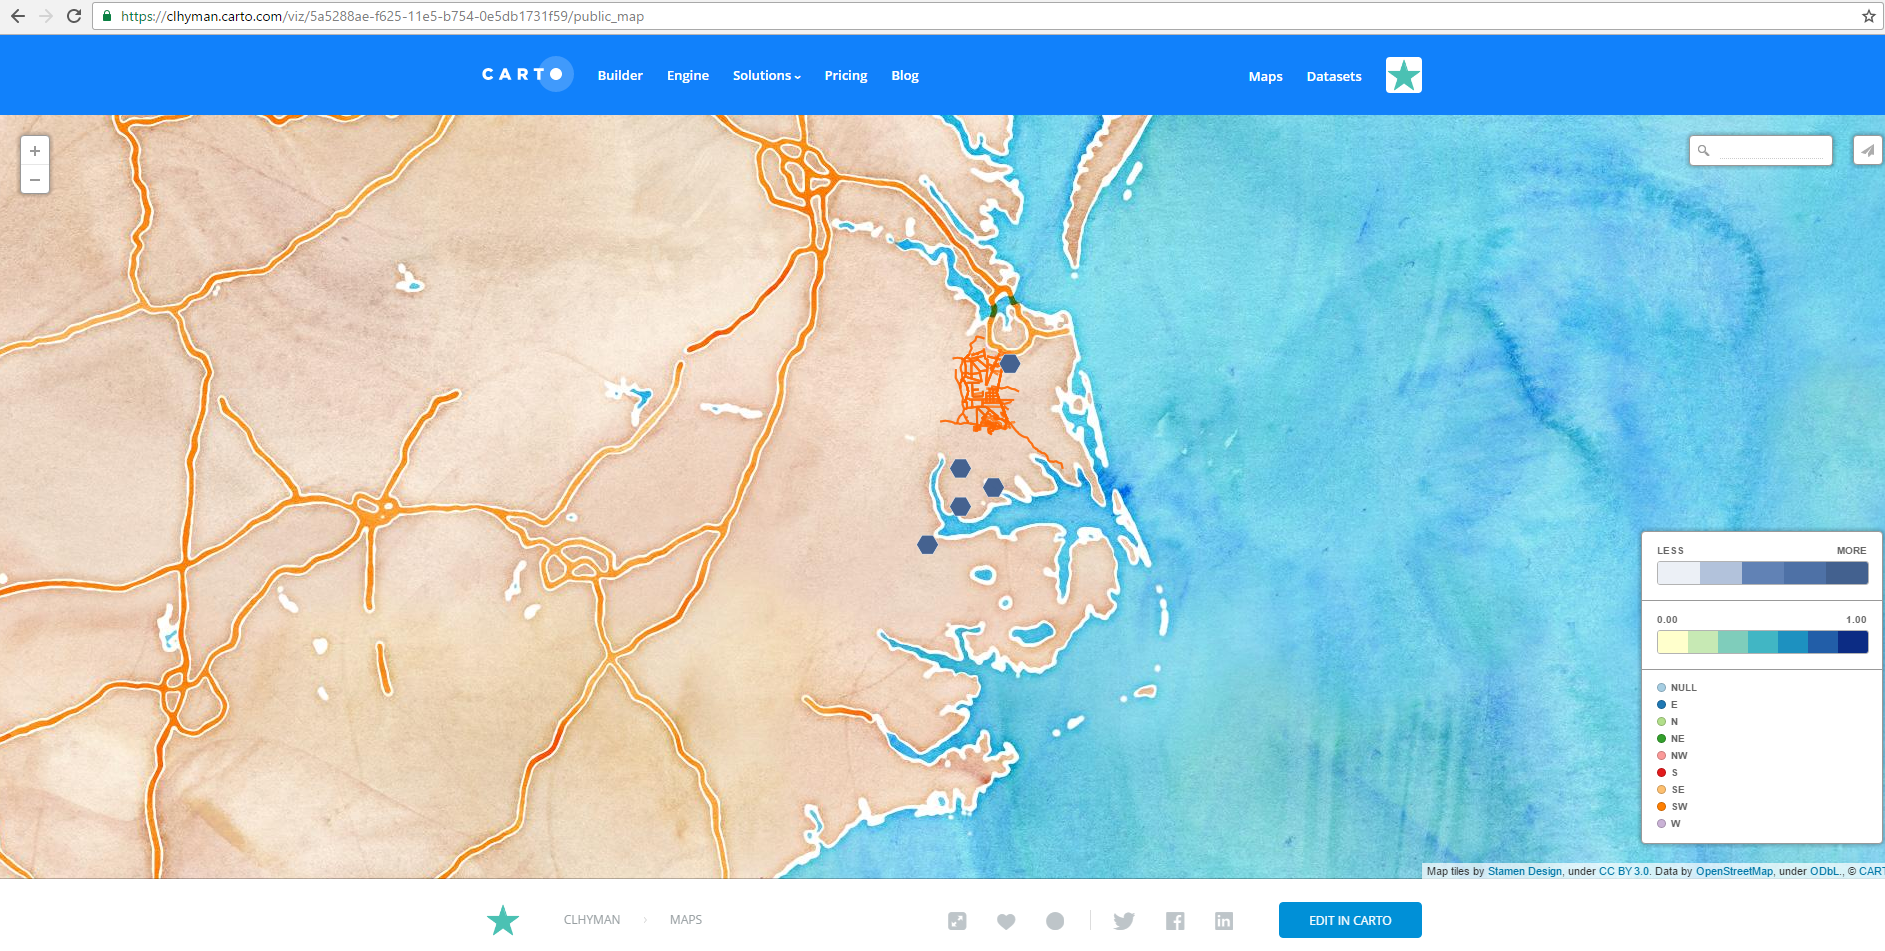
Using a different basemap I imported data gathered on several enslaved runaways who absconded from several eastern North Carolina plantations between 1805 to 1840; you may notice that the map has no boundaries. This was more than a stylistic choice, it was interpretive in order to indicate that enslaved runaways who wished to get northward to freedom were under threat as long as they were within the southern domain.
Google Maps:
Google My maps provides geospatial opportunities as well. I was able to create a map in Google MyMaps identifying several locations of art around the city of Lincoln, Nebraska.
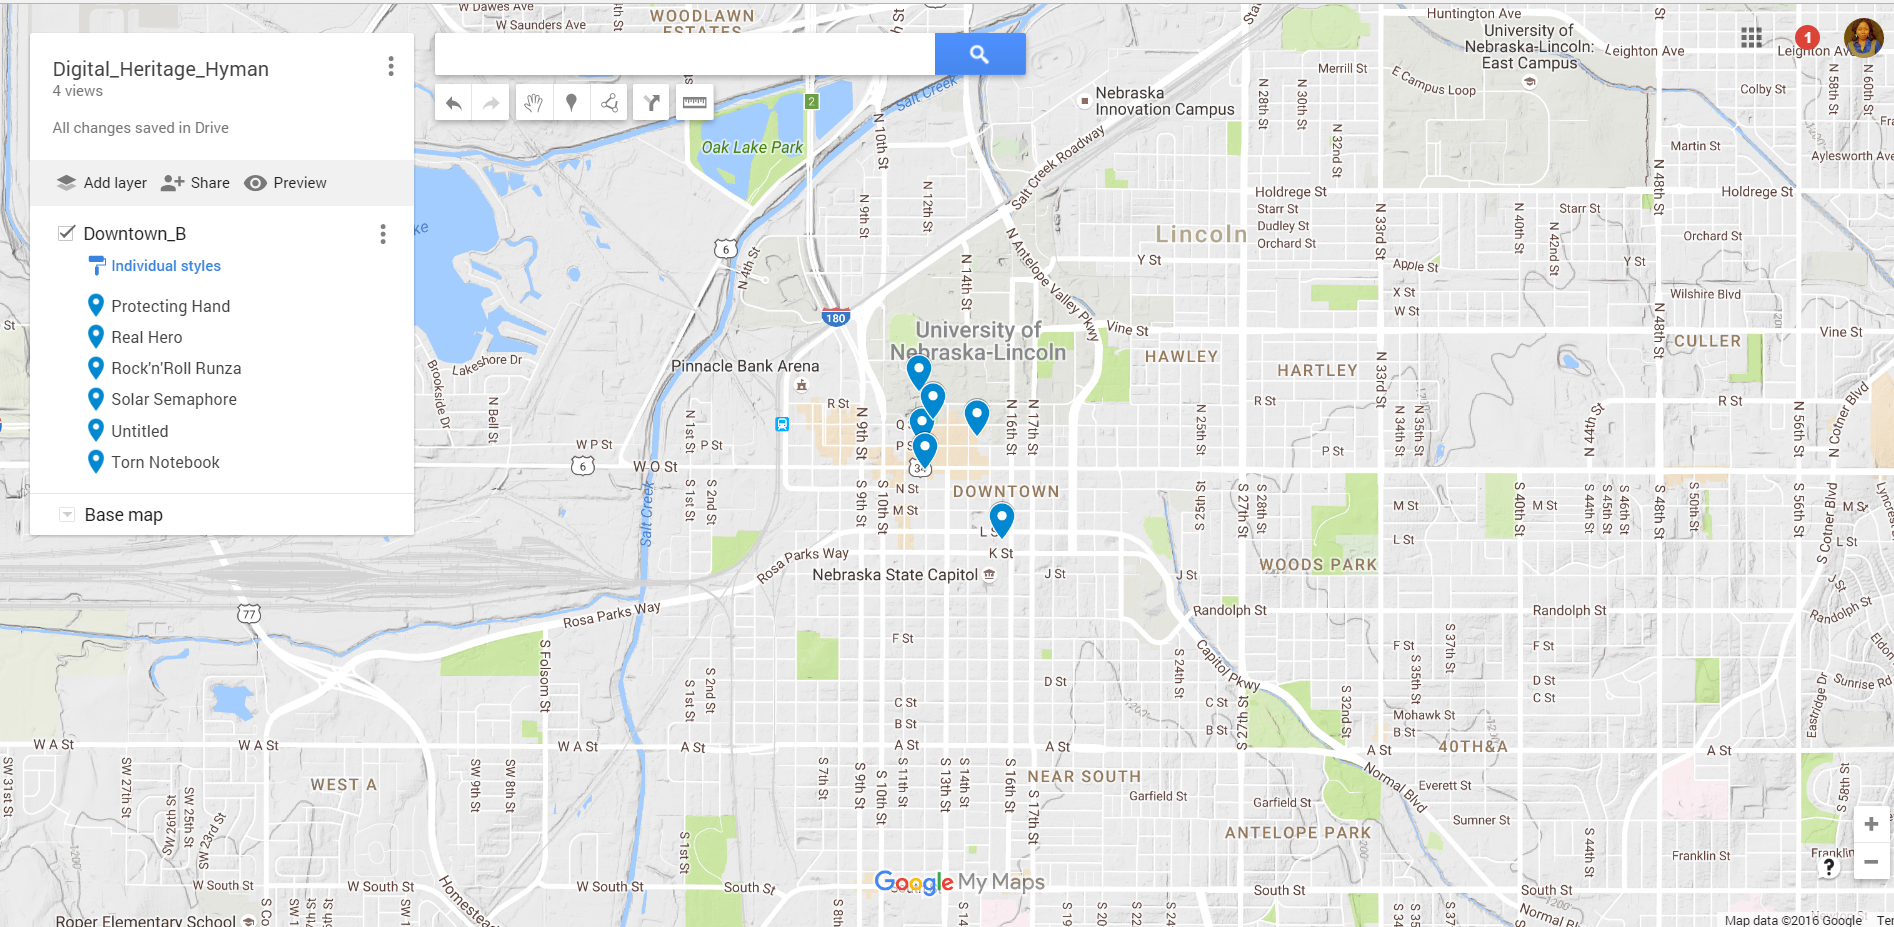
MyMap Instructions
If you’d like to try this in your own community go to My Maps https://www.google.com/maps/d/
- Sign into your Google Account
2. Click Create New Map. Identify the locations you wish to display by pointing and naming the location.
3. Click Untitled Map and enter a Title. Save
4. Hover over the three vertical dots in the Untitled Layer box (on right). Left click and name
Layer.
Lab activity Considerations:
- How can I link this lab to lectures?
- How can I clearly communicate the criteria used in grading the lab reports?
- What kind of preparation should my students do before they come to lab?
- What tips can I give my students, so they can complete the lab successfully within the time allotted?
- Would it be helpful if I demonstrated new techniques to the students?
- How will I monitor student progress in the lab?
- Where might my students run into difficulty completing the experiment?
- What kinds of questions should I ask my students to stimulate their thinking and to encourage deeper understanding of the activity?
Datasets
Datasets provide opportunities for analysis and are an excellent way for students to perform a variety of GIS functions as they learn a new geospatial tool. Instructors must emphasize the importance of analyzing data beforehand as it helps students with conceptualizing how geospatial processes fit together to explore a scholarly inquiry. If you have no data gathered the link below will take you to some datasets for student use.
http://guides.library.yale.edu/GIS/gisworkshoparchive
Resources
As you think about integrating GIS into teaching history several blogs are helpful as you consider that spatial journey:
Sandbox Blog
The Sandbox blog includes information about ongoing GIS and 3D modeling projects, workshops, tools, and tutorials and is run by the Institute for Digital Research and Education, a cooperative of faculty and technologists working to advance the existing body of computing knowledge and expertise at UCLA.
http://sandbox.idre.ucla.edu/sandbox/basics-of-mapping-for-the-digital-humanities
Miriam Posner’s Blog
Miriam Posner coordinates and teaches in the Digital Humanities program at UCLA as well as serves on the executive committee of the Association for Computers and the Humanities. Her blog is especially useful to me in studies on the digital humanities.
The spatial turn has created infinite possibilities for scholars and students and mapping has the potential to uncover hidden patterns, relationships and trends that have been absent from the historical record. Going forward I hope instructors and students of history continue to share and collaborate with others to bolster the engagement of geospatial technologies in the humanities.
